Showcasing Urban Trees for Environmental Education with IoT Technology. SUTEE is an ERASMUS+ Strategic Cooperation Partnership in the field of school education project.
Madrid’s Heat Map: Discover if You Live in a High-Temperature Zone
On
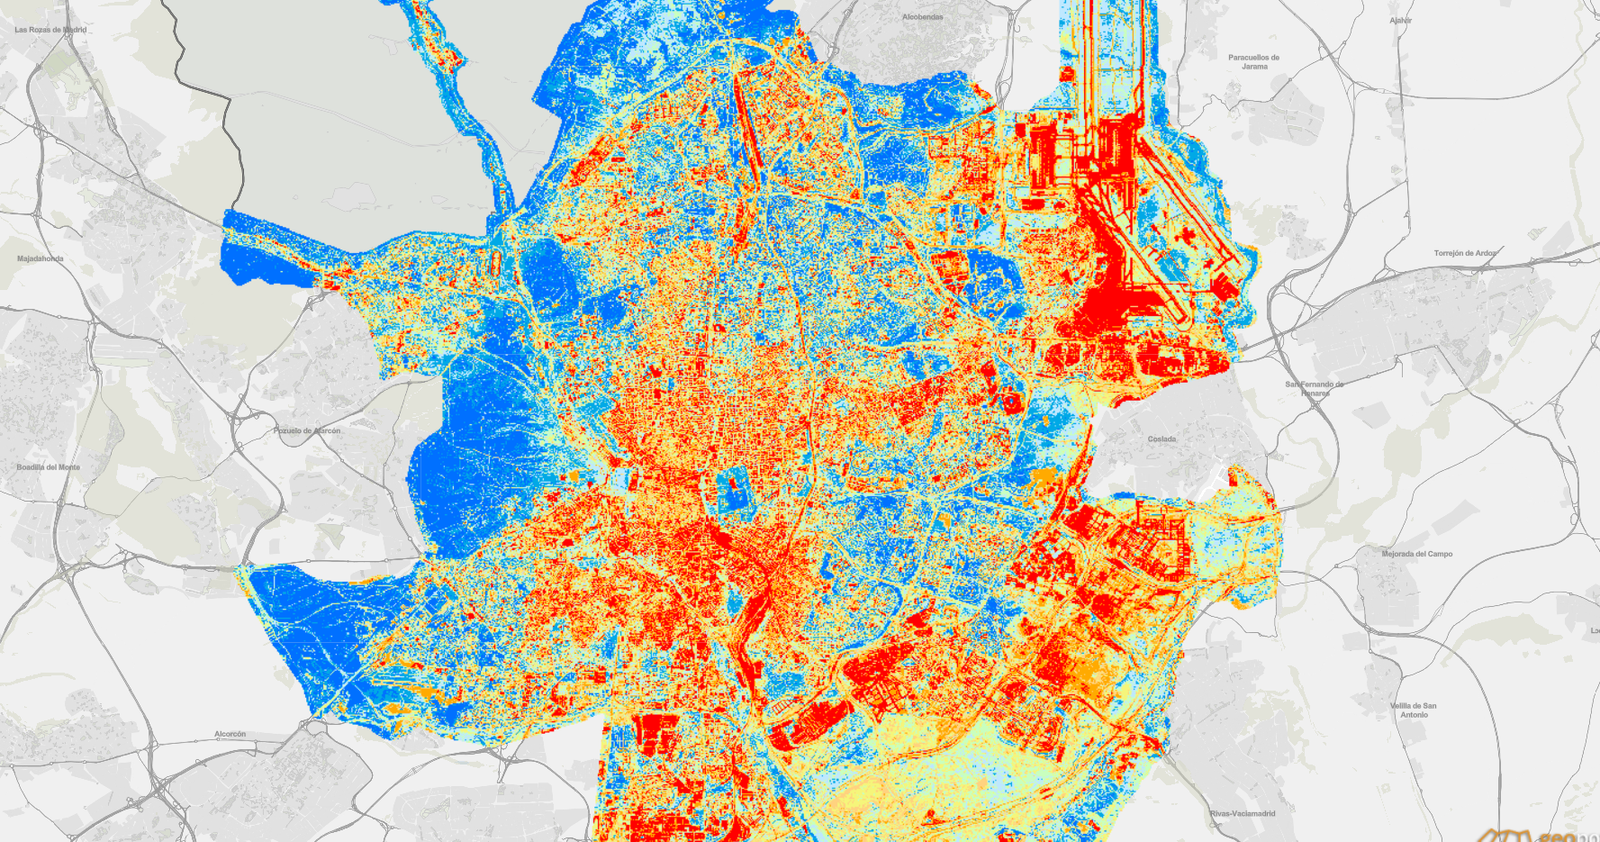
The city of Madrid has released a detailed heat map that allows residents to see if they live in an area affected by extreme temperatures. This initiative highlights the increasing impact of urban heat islands, a phenomenon where certain areas of the city experience significantly higher temperatures due to factors like dense construction and a lack of green spaces.
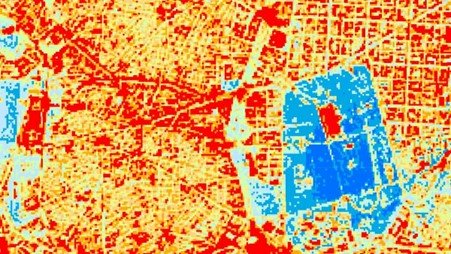
Using data from the Landsat 8 satellite, the map classifies the city into eight categories of thermal comfort, ranging from low to extremely high. Areas like the city center, including districts such as Salamanca, Chamberí, and Arganzuela, are marked as having “high” to “extremely high” heat levels. In contrast, neighborhoods near parks like El Retiro and Casa de Campo enjoy cooler conditions, providing a respite from the scorching summer temperatures.
The heat map is part of Madrid’s broader strategy to raise awareness of climate-related challenges and encourage urban planning solutions to mitigate heat, such as increasing green spaces and promoting energy-efficient building practices. The data is freely accessible on the city’s Geoportal, enabling residents to see how heat affects their neighborhoods and plan accordingly during extreme heat events.
This effort comes in response to rising summer temperatures, which are exacerbated by the climate crisis, making Madrid’s urban heat island phenomenon more severe in recent years